Working with netsh network traces

In my previous post regarding useful commands I showed how to perform a packet capture between a client machine and a remote machine using IP filters. When the capture is complete you will end up with a .etl file which requires Microsoft Message Analyzer.
Collecting a capture:
As a refresher the process to perform a netsh packet capture is as follows:
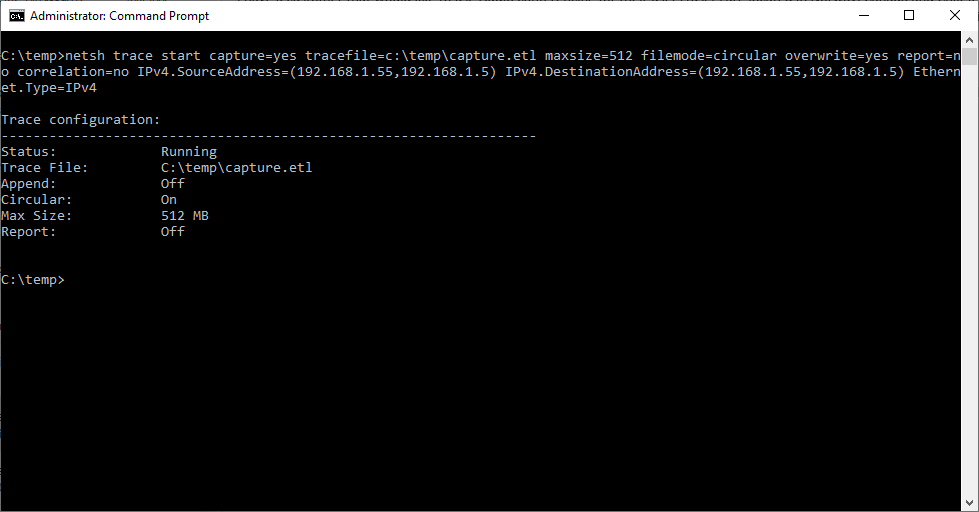
- To start your packet capture you need to first issue the following command:
netsh trace start capture=yes tracefile=c:\temp\capture.etl maxsize=512 filemode=circular overwrite=yes report=no correlation=no IPv4.SourceAddress=(192.168.1.55,192.168.1.5) IPv4.DestinationAddress=(192.168.1.55,192.168.1.5) Ethernet.Type=IPv4
2. After the trace has started reproduce the behavior you are looking to capture. In our example we will be using psping to generate traffic between IPs 192.168.1.55 & 192.168.1.5.

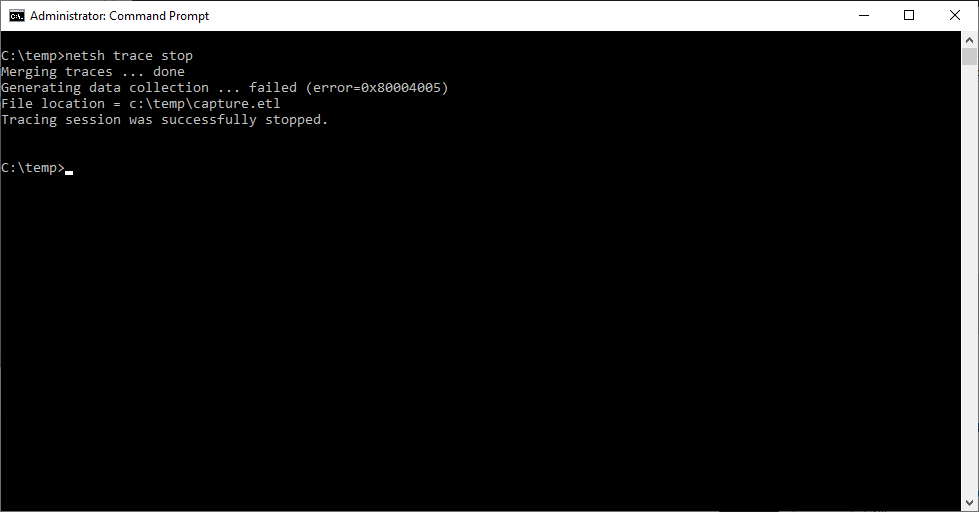
3. Now that we have reproduced the behavior you must stop the netsh trace, this process takes time and is initialized using the following command:
netsh trace stop
Analyzing the capture:
My personal preference is to use WireShark to process the results of netsh packet captures. Unfortunately WireShark cannot directly open .etl files so you must first open the file with Microsoft Message Analyzer and then export the results to a .cap file which WireShark can process. One thing to keep in mind is that the larger the capture the more resources that Microsoft Message Analyzer which can put a big strain on your system
Converting .etl to .cap:
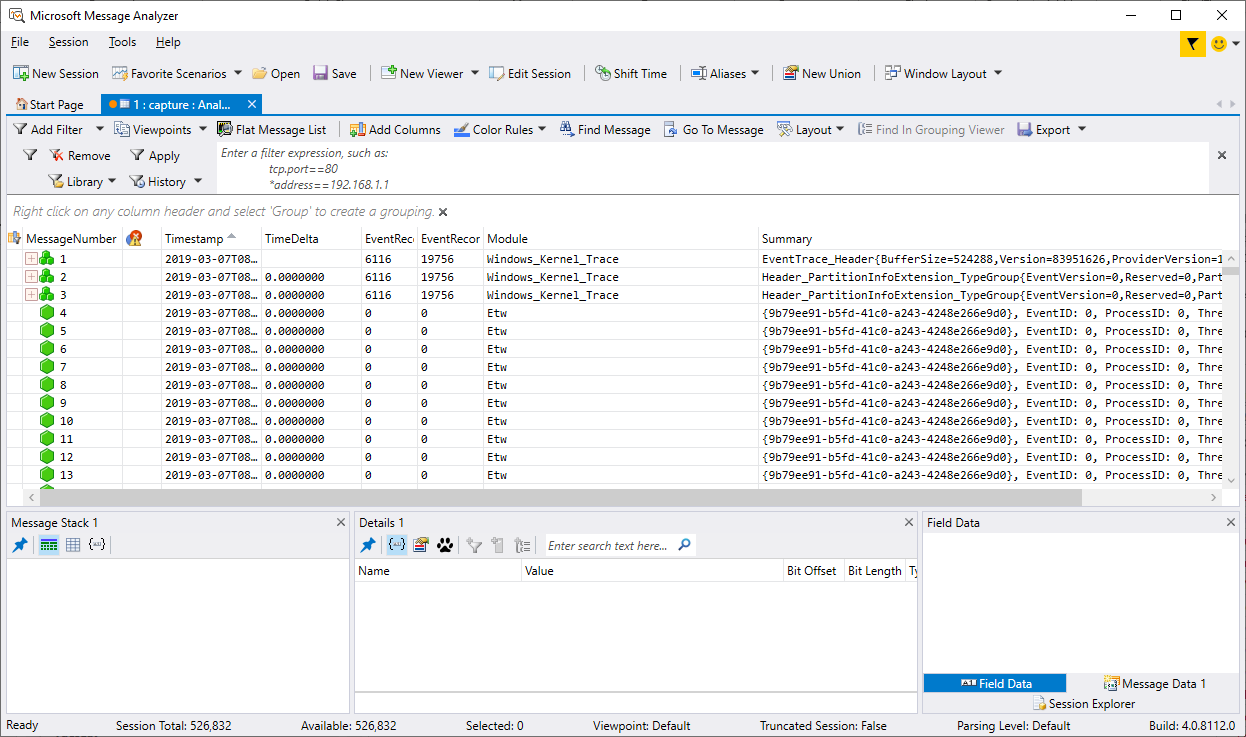
In order to open the capture in WireShark we start by opening the capture in Microsoft Message Analyzer:
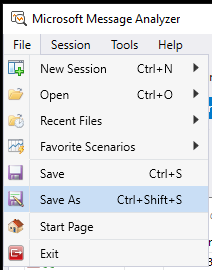
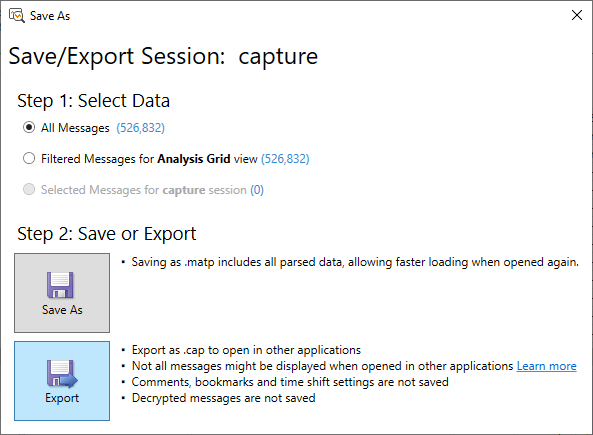
Once the file has been fully loaded you go to File then Save As:
From the Save As window click on Export:
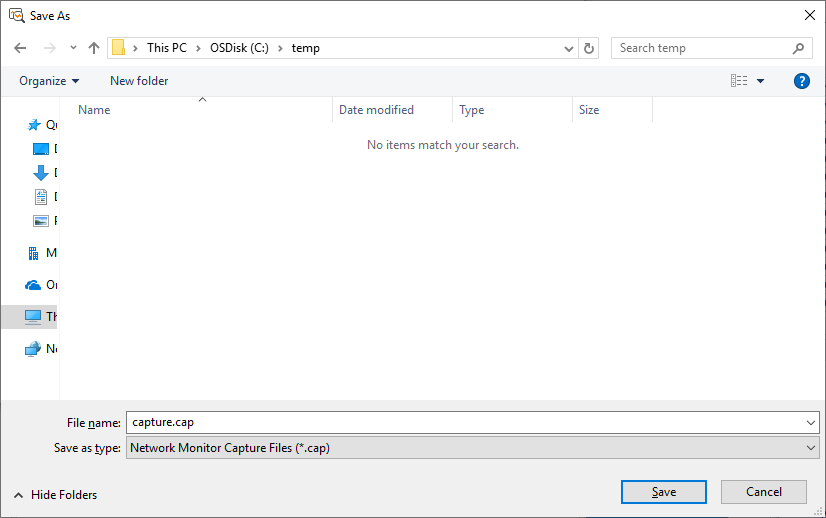
Next we want to specify the file name, make sure that you select .cap:
When the export is performed you will get a message indicating that some of the messages where incompatible and were not exported:
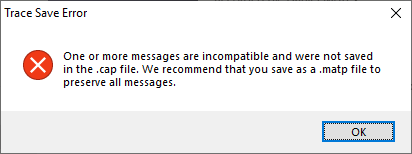
At this point the .etl file we started with has been converted to a .cap file which can now be opened in WireShark.
Viewing the .cap with WireShark:
Now that we have a .cap file you can open this using WireShark. Once the file has been opened you will be greeted with a screen similar to the following:
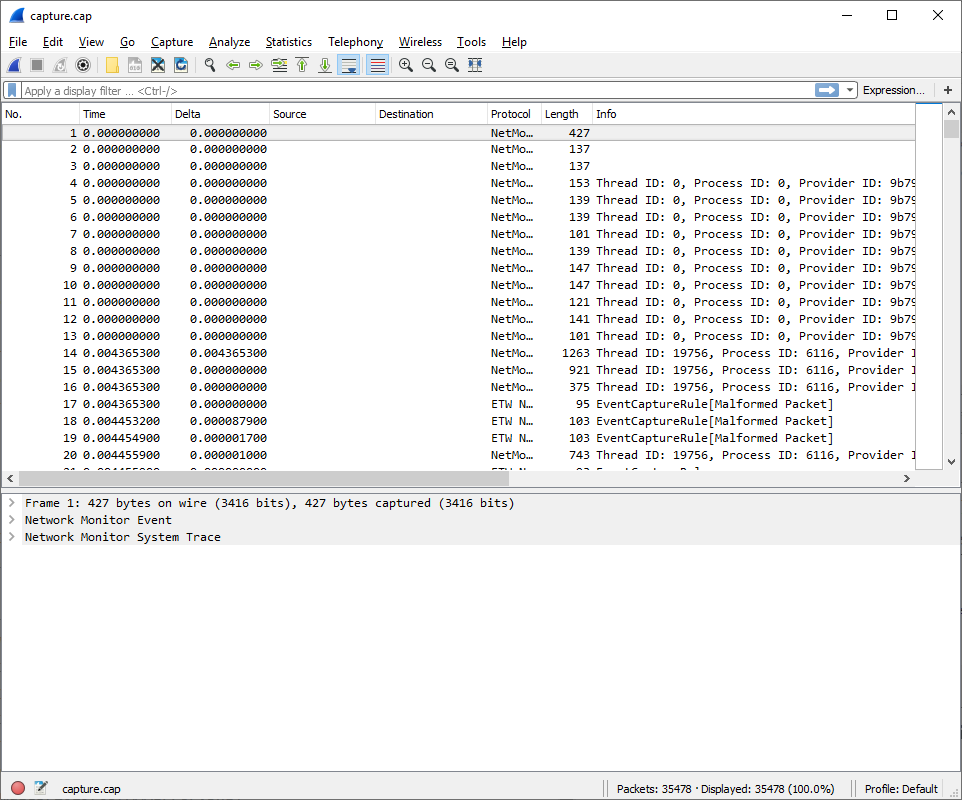
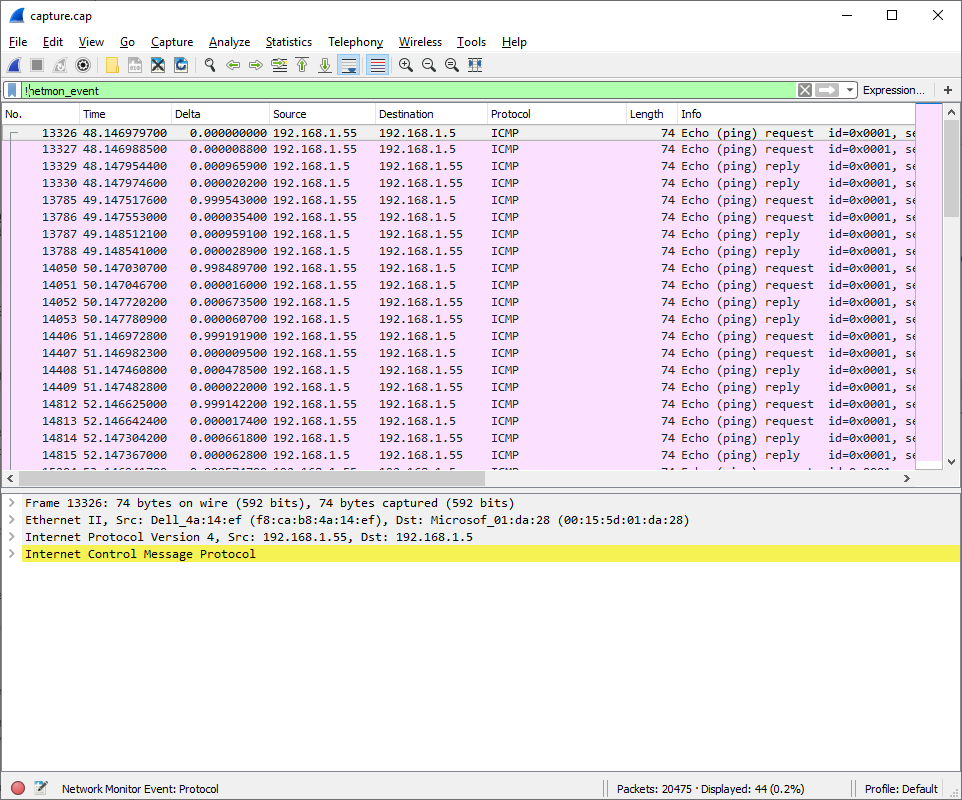
First thing you will notice is this doesn't look like a normal packet capture. The reason for this is there are additional NetMon_Events that can be filtered out to get the data we are really after. To do this add the following filter to WireShark:
!netmon_event
This will give us much cleaner trace to then read through:
I'm not going to go into WireShark filters at this time although I might in the future. For now if you need additional details on the different filters available take a look at https://wiki.wireshark.org/CaptureFilters.